
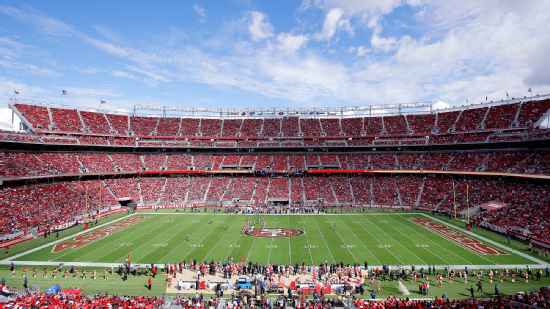
Atlanta Falcons @ San Francisco 49ers

5-9, 3-4 Away
29
5-9, 3-4 Away

11-3, 5-2 Home
22
11-3, 5-2 Home
Game Leaders


Team Stats


290
Total Yards
313
1
Turnovers
2
20
1st Downs
20
11-98
Penalties
7-67
7/13
3rd Down
4/12
0/0
4th Down
1/1
3/3
Red Zone
2/3
29:12
Possession
30:48
Game Information
Santa Clara, CA
Team Stats
 | | |
|---|---|---|
| 1st Downs | 20 | 20 |
| Passing 1st downs | 14 | 10 |
| Rushing 1st downs | 3 | 8 |
| 1st downs from penalties | 3 | 2 |
| 3rd down efficiency | 7-13 | 4-12 |
| 4th down efficiency | 0-0 | 1-1 |
| Total Plays | 61 | 62 |
| Total Yards | 290 | 313 |
| Total Drives | 10 | 11 |
| Yards per Play | 4.8 | 5.0 |
| Passing | 201 | 193 |
| Comp/Att | 25/39 | 22/34 |
| Yards per pass | 4.9 | 5.5 |
| Interceptions thrown | 0 | 0 |
| Sacks-Yards Lost | 2-9 | 1-7 |
| Rushing | 89 | 120 |
| Rushing Attempts | 20 | 27 |
| Yards per rush | 4.5 | 4.4 |
| Red Zone (Made-Att) | 3-3 | 2-3 |
| Penalties | 11-98 | 7-67 |
| Turnovers | 1 | 2 |
| Fumbles lost | 1 | 2 |
| Interceptions thrown | 0 | 0 |
| Defensive / Special Teams TDs | 1 | 0 |
| Possession | 29:12 | 30:48 |
ATL @ SF Videos
Hasselbeck: Falcons look different from the beginning of the year
2025 Standings
National Football Conference
| NFC South | W | L | T | PCT | PF | PA |
|---|---|---|---|---|---|---|
| Tampa Bay | 6 | 2 | 0 | .750 | 197 | 178 |
| Carolina | 5 | 4 | 0 | .556 | 170 | 205 |
| Atlanta | 3 | 5 | 0 | .375 | 143 | 178 |
| New Orleans | 1 | 8 | 0 | .111 | 138 | 243 |
| NFC West | W | L | T | PCT | PF | PA |
|---|---|---|---|---|---|---|
| Seattle | 6 | 2 | 0 | .750 | 231 | 150 |
| Los Angeles | 6 | 2 | 0 | .750 | 209 | 127 |
| San Francisco | 6 | 3 | 0 | .667 | 194 | 188 |
| Arizona | 3 | 5 | 0 | .375 | 180 | 171 |
NFL News
NFL Week 10 predictions, fantasy sleepers, QB notes, bets
Will J.J. McCarthy work more outside the pocket? How will Sauce Gardner fare in his Colts debut? Upset brewing in Patriots-Bucs? Here's what to know for Week 10.
4h

Why Keenan Allen is playing with a chip on his shoulder
Keenan Allen has already more than proved himself in his return to Los Angeles.
4h

With C.J. Stroud out, Texans are comfortable with Davis Mills
Davis Mills has started plenty of games for the Texans, and coach DeMeco Ryans believes he's ready for Sunday.
4h