
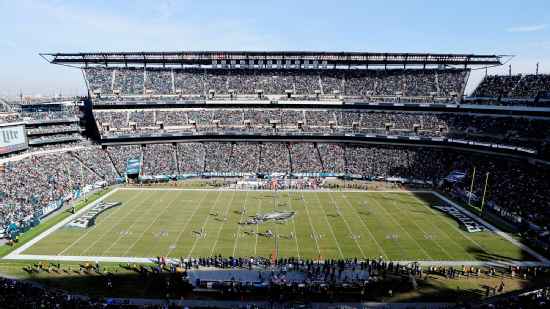
Atlanta Falcons @ Philadelphia Eagles
NFC DIVISIONAL PLAYOFF

10-6, 5-3 Away
10
10-6, 5-3 Away

13-3, 7-1 Home
15
13-3, 7-1 Home
Game Leaders

210
M. RyanQB
22/36, 1 TD
210

246
N. FolesQB
23/30
246

79
T. ColemanRB
10 CAR
79

54
J. AjayiRB
15 CAR
54

101
J. JonesWR
9 REC
101

61
A. JefferyWR
4 REC
61

1
T. McKinleyDE
1

1
F. CoxDT
1

8
R. AlfordCB
7 SOLO
8

8
M. JenkinsS
6 SOLO
8
Team Stats


281
Total Yards
334
0
Turnovers
2
19
1st Downs
22
4-73
Penalties
4-24
4/13
3rd Down
6/13
1/2
4th Down
1/1
1/3
Red Zone
1/3
27:54
Possession
32:06
Game Information
Philadelphia, PA
Side Judge:Allen Baynes
Down Judge:Ed Camp
Referee:Bill Vinovich
Field Judge:Tom Hill
Line Judge:Byron Boston
Umpire:Mark Pellis
Side Judge:Shawn Hochuli
Team Stats
 | | |
|---|---|---|
| 1st Downs | 19 | 22 |
| Passing 1st downs | 11 | 12 |
| Rushing 1st downs | 6 | 8 |
| 1st downs from penalties | 2 | 2 |
| 3rd down efficiency | 4-13 | 6-13 |
| 4th down efficiency | 1-2 | 1-1 |
| Total Plays | 59 | 63 |
| Total Yards | 281 | 334 |
| Total Drives | 9 | 9 |
| Yards per Play | 4.8 | 5.3 |
| Passing | 195 | 238 |
| Comp/Att | 22/36 | 23/30 |
| Yards per pass | 5.0 | 7.7 |
| Interceptions thrown | 0 | 0 |
| Sacks-Yards Lost | 3-15 | 1-8 |
| Rushing | 86 | 96 |
| Rushing Attempts | 20 | 32 |
| Yards per rush | 4.3 | 3.0 |
| Red Zone (Made-Att) | 1-3 | 1-3 |
| Penalties | 4-73 | 4-24 |
| Turnovers | 0 | 2 |
| Fumbles lost | 0 | 2 |
| Interceptions thrown | 0 | 0 |
| Defensive / Special Teams TDs | 0 | 0 |
| Possession | 27:54 | 32:06 |
2025 Standings
National Football Conference
| NFC South | W | L | T | PCT | PF | PA |
|---|---|---|---|---|---|---|
| Tampa Bay | 6 | 3 | 0 | .667 | 220 | 206 |
| Carolina | 5 | 5 | 0 | .500 | 177 | 222 |
| Atlanta | 3 | 6 | 0 | .333 | 168 | 209 |
| New Orleans | 2 | 8 | 0 | .200 | 155 | 250 |
| NFC East | W | L | T | PCT | PF | PA |
|---|---|---|---|---|---|---|
| Philadelphia | 7 | 2 | 0 | .778 | 218 | 192 |
| Dallas | 3 | 5 | 1 | .389 | 263 | 277 |
| Washington | 3 | 7 | 0 | .300 | 223 | 280 |
| New York | 2 | 8 | 0 | .200 | 217 | 273 |
NFL News

Buzz: With Travis Hunter out for the season, are there any Jaguars WRs to add?
With Travis Hunter now officially sidelined for the rest of 2025, Eric Moody takes a closer look at who to add on the Jaguars.
3h
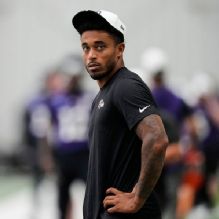
Source: Eagles' Jaire Alexander, 28, stepping away from NFL
Former Pro Bowl cornerback Jaire Alexander has decided to step away from football in order to focus on getting right physically and mentally amid his ongoing recovery from offseason knee surgery, a league source confirmed to ESPN on Tuesday.
3h

What Travis Hunter's season-ending injury means for Jaguars
What is an LCL injury? How long will Hunter be sidelined? Here's what we know about his future.
2h