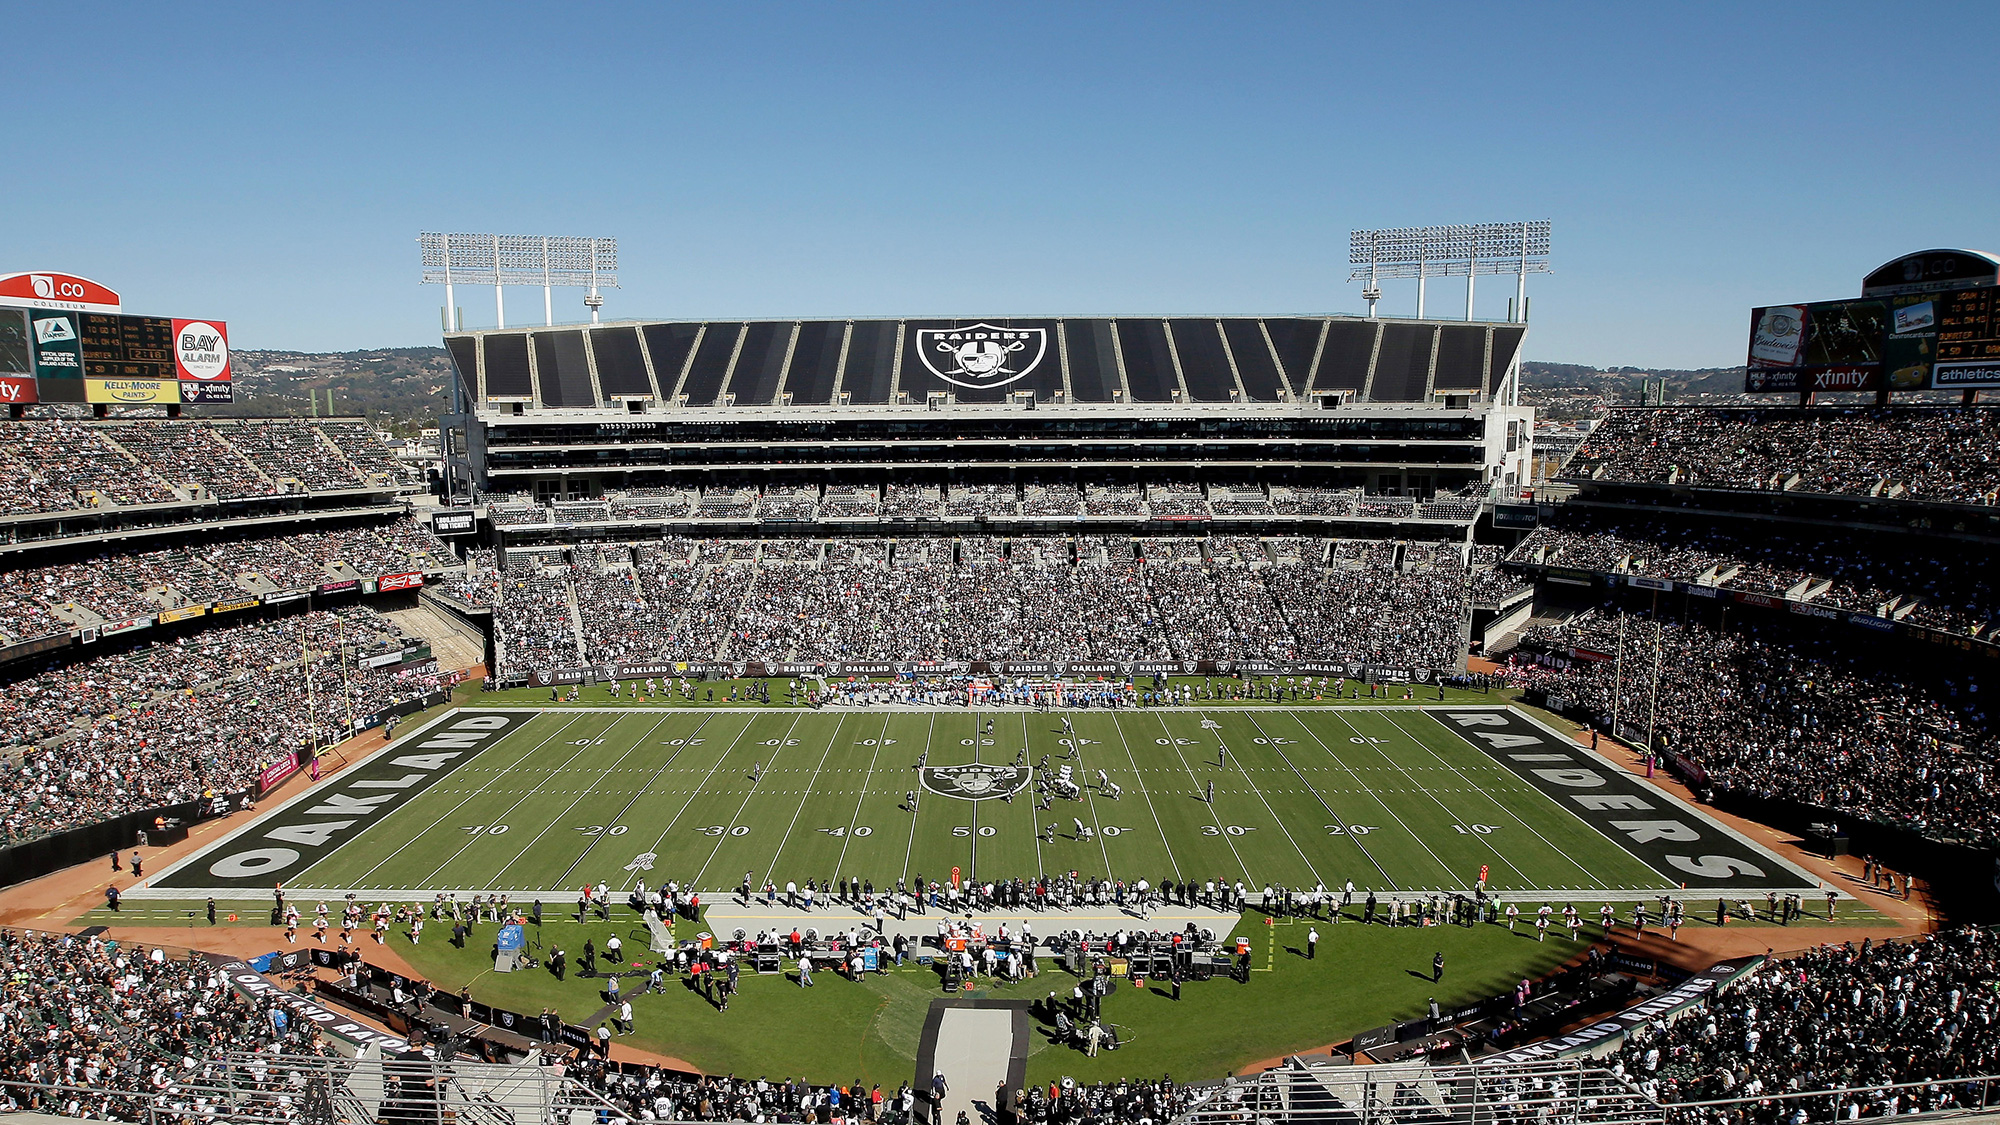
Los Angeles Chargers @ Oakland Raiders
Game Leaders
Team Stats
343
Total Yards
274
1
Turnovers
2
20
1st Downs
15
4-32
Penalties
5-40
6/14
3rd Down
6/12
1/2
4th Down
0/1
2/3
Red Zone
0/1
32:03
Possession
27:57
Game Information
Oakland, CA


Team Stats
| 1st Downs | 20 | 15 |
| Passing 1st downs | 15 | 7 |
| Rushing 1st downs | 5 | 6 |
| 1st downs from penalties | 0 | 2 |
| 3rd down efficiency | 6-14 | 6-12 |
| 4th down efficiency | 1-2 | 0-1 |
| Total Plays | 65 | 53 |
| Total Yards | 343 | 274 |
| Total Drives | 10 | 10 |
| Yards per Play | 5.3 | 5.2 |
| Passing | 263 | 165 |
| Comp/Att | 25/36 | 21/30 |
| Yards per pass | 7.1 | 5.3 |
| Interceptions thrown | 0 | 2 |
| Sacks-Yards Lost | 1-5 | 1-6 |
| Rushing | 80 | 109 |
| Rushing Attempts | 28 | 22 |
| Yards per rush | 2.9 | 5.0 |
| Red Zone (Made-Att) | 2-3 | 0-1 |
| Penalties | 4-32 | 5-40 |
| Turnovers | 1 | 2 |
| Fumbles lost | 1 | 0 |
| Interceptions thrown | 0 | 2 |
| Defensive / Special Teams TDs | 0 | 0 |
| Possession | 32:03 | 27:57 |
LAC @ OAK Videos
Who are these Raiders?
- 2:11
2025 Standings
American Football Conference
| AFC West | W | L | T | PCT | PF | PA |
|---|---|---|---|---|---|---|
| Denver | 8 | 2 | 0 | .800 | 235 | 173 |
| Los Angeles | 7 | 3 | 0 | .700 | 240 | 203 |
| Kansas City | 5 | 4 | 0 | .556 | 235 | 159 |
| Las Vegas | 2 | 7 | 0 | .222 | 139 | 220 |
NFL News

Buzz: With Travis Hunter out for the season, are there any Jaguars WRs to add?
With Travis Hunter now officially sidelined for the rest of 2025, Eric Moody takes a closer look at who to add on the Jaguars.
9h

Source: Eagles' Jaire Alexander, 28, stepping away from NFL
Former Pro Bowl cornerback Jaire Alexander has decided to step away from football in order to focus on getting right physically and mentally amid his ongoing recovery from offseason knee surgery, a league source confirmed to ESPN on Tuesday.
2h

What Travis Hunter's season-ending injury means for Jaguars
What is an LCL injury? How long will Hunter be sidelined? Here's what we know about his future.
7h
ESPN BET Sportsbook is owned and operated by PENN Entertainment, Inc. and its subsidiaries ('PENN'). ESPN BET is available in states where PENN is licensed to offer sports wagering. Must be 21+ to wager. If you or someone you know has a gambling problem and wants help, call 1-800-GAMBLER.
Copyright: © 2025 ESPN Enterprises, Inc. All rights reserved.


