
San Francisco 49ers @ Houston Texans

3-10, 2-5 Away
26
3-10, 2-5 Away

4-9, 3-4 Home
16
4-9, 3-4 Home
Game Leaders


Team Stats


416
Total Yards
311
1
Turnovers
1
20
1st Downs
18
11-87
Penalties
8-81
2/11
3rd Down
3/13
0/0
4th Down
1/2
2/4
Red Zone
1/1
34:49
Possession
25:11
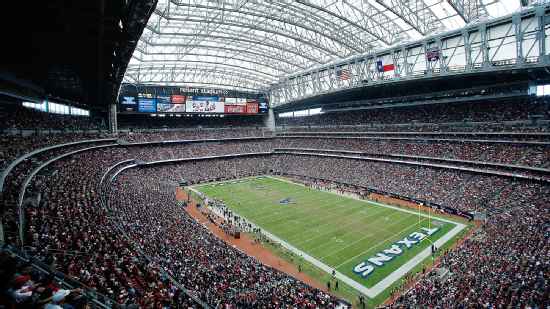
Game Information
Houston, TX
Team Stats
 | | |
|---|---|---|
| 1st Downs | 20 | 18 |
| Passing 1st downs | 12 | 12 |
| Rushing 1st downs | 4 | 4 |
| 1st downs from penalties | 4 | 2 |
| 3rd down efficiency | 2-11 | 3-13 |
| 4th down efficiency | 0-0 | 1-2 |
| Total Plays | 66 | 64 |
| Total Yards | 416 | 311 |
| Total Drives | 13 | 12 |
| Yards per Play | 6.3 | 4.9 |
| Passing | 314 | 221 |
| Comp/Att | 20/33 | 20/38 |
| Yards per pass | 9.0 | 5.4 |
| Interceptions thrown | 1 | 0 |
| Sacks-Yards Lost | 2-20 | 3-17 |
| Rushing | 102 | 90 |
| Rushing Attempts | 31 | 23 |
| Yards per rush | 3.3 | 3.9 |
| Red Zone (Made-Att) | 2-4 | 1-1 |
| Penalties | 11-87 | 8-81 |
| Turnovers | 1 | 1 |
| Fumbles lost | 0 | 1 |
| Interceptions thrown | 1 | 0 |
| Defensive / Special Teams TDs | 0 | 0 |
| Possession | 34:49 | 25:11 |
2025 Standings
National Football Conference
| NFC West | W | L | T | PCT | PF | PA |
|---|---|---|---|---|---|---|
| Los Angeles | 8 | 2 | 0 | .800 | 272 | 172 |
| Seattle | 7 | 3 | 0 | .700 | 294 | 193 |
| San Francisco | 7 | 4 | 0 | .636 | 261 | 252 |
| Arizona | 3 | 7 | 0 | .300 | 224 | 256 |
American Football Conference
| AFC South | W | L | T | PCT | PF | PA |
|---|---|---|---|---|---|---|
| Indianapolis | 8 | 2 | 0 | .800 | 321 | 206 |
| Jacksonville | 6 | 4 | 0 | .600 | 240 | 226 |
| Houston | 5 | 5 | 0 | .500 | 220 | 163 |
| Tennessee | 1 | 9 | 0 | .100 | 143 | 273 |
NFL News

Cam Skattebo, Giants get into melee with Judgement Day at 'Raw'
The New York Giants took matters into their own hands -- or fists -- when Judgement Day called them out at WWE's "Monday Night Raw."
34m
Cowboys' Lamb, Pickens don't play 1st series in coach's decision
Cowboys wide receivers CeeDee Lamb and George Pickens were kept on the bench for the first series Monday night against the Raiders in what the team said was a coach's decision.
2h

NFL Week 11's best arrivals -- from CeeDee Lamb to DeVonta Smith
NFL stars didn't just show up to play -- they showed up in style. Here are this week's best looks.
5h