
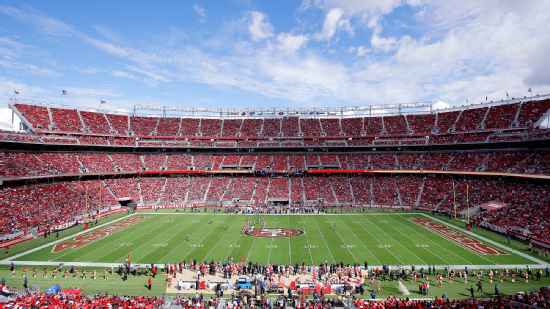
Dallas Cowboys @ San Francisco 49ers

3-3, 2-1 Away
40
3-3, 2-1 Away

0-7, 0-3 Home
10
0-7, 0-3 Home
Game Leaders

234
D. PrescottQB
16/25, 3 TD
234

235
C.J. BeathardQB
22/38
235
147
E. ElliottRB
26 CAR, 2 TD
147
68
C. HydeRB
14 CAR
68
72
E. ElliottRB
1 REC, 1 TD
72

80
M. GoodwinWR
4 REC
80

1
T. CrawfordDE
1

--
--
8
A. HitchensLB
8 SOLO
8

7
D. JohnsonCB
7 SOLO
7
Team Stats


501
Total Yards
290
0
Turnovers
3
27
1st Downs
23
5-36
Penalties
2-22
7/11
3rd Down
6/13
0/1
4th Down
0/2
4/6
Red Zone
1/2
32:50
Possession
27:10
Game Information
Santa Clara, CA
Team Stats
 | | |
|---|---|---|
| 1st Downs | 27 | 23 |
| Passing 1st downs | 12 | 12 |
| Rushing 1st downs | 14 | 9 |
| 1st downs from penalties | 1 | 2 |
| 3rd down efficiency | 7-11 | 6-13 |
| 4th down efficiency | 0-1 | 0-2 |
| Total Plays | 70 | 65 |
| Total Yards | 501 | 290 |
| Total Drives | 12 | 10 |
| Yards per Play | 7.2 | 4.5 |
| Passing | 236 | 187 |
| Comp/Att | 17/27 | 22/38 |
| Yards per pass | 8.7 | 4.3 |
| Interceptions thrown | 0 | 0 |
| Sacks-Yards Lost | 0-0 | 5-48 |
| Rushing | 265 | 103 |
| Rushing Attempts | 43 | 22 |
| Yards per rush | 6.2 | 4.7 |
| Red Zone (Made-Att) | 4-6 | 1-2 |
| Penalties | 5-36 | 2-22 |
| Turnovers | 0 | 3 |
| Fumbles lost | 0 | 3 |
| Interceptions thrown | 0 | 0 |
| Defensive / Special Teams TDs | 0 | 0 |
| Possession | 32:50 | 27:10 |
2025 Standings
National Football Conference
| NFC East | W | L | T | PCT | PF | PA |
|---|---|---|---|---|---|---|
| Philadelphia | 6 | 2 | 0 | .750 | 208 | 185 |
| Dallas | 3 | 5 | 1 | .389 | 263 | 277 |
| Washington | 3 | 6 | 0 | .333 | 201 | 236 |
| New York | 2 | 7 | 0 | .222 | 197 | 249 |
| NFC West | W | L | T | PCT | PF | PA |
|---|---|---|---|---|---|---|
| Seattle | 6 | 2 | 0 | .750 | 231 | 150 |
| Los Angeles | 6 | 2 | 0 | .750 | 209 | 127 |
| San Francisco | 6 | 3 | 0 | .667 | 194 | 188 |
| Arizona | 3 | 5 | 0 | .375 | 180 | 171 |
NFL News
Why Ryan Clark says Kyler Murray has started his last game for Cardinals
Ryan Clark, Bart Scott and Peter Schrager discuss whether Kyler Murray has played his last game for the Cardinals.
44m
Why Bart Scott thinks Jaxon Smith-Njigba is a top MVP candidate
Bart Scott joins "Get Up" to make the argument that Jaxon Smith-Njigba should be in the NFL MVP conversation.
42m
Bart Scott: The Broncos are being held back by QB Bo Nix
Bart Scott, Peter Schrager, Ryan Clark and Joe Fortenbaugh discuss whether the Broncos are real contenders given quarterback Bo Nix's current play.
19m