
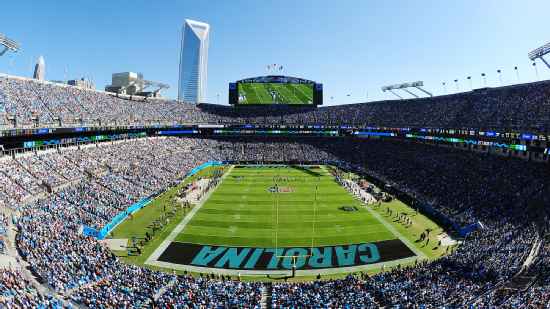
San Francisco 49ers @ Carolina Panthers
NFC DIVISIONAL PLAYOFF

12-4, 6-2 Away
23
12-4, 6-2 Away

12-4, 7-1 Home
10
12-4, 7-1 Home
Game Leaders


Team Stats


315
Total Yards
325
0
Turnovers
2
21
1st Downs
18
5-40
Penalties
8-73
6/14
3rd Down
6/10
0/1
4th Down
0/1
2/4
Red Zone
0/3
29:55
Possession
30:05
Game Information
Charlotte, NC
Referee:Carl Cheffers
Team Stats
 | | |
|---|---|---|
| 1st Downs | 21 | 18 |
| Passing 1st downs | 11 | 9 |
| Rushing 1st downs | 5 | 7 |
| 1st downs from penalties | 5 | 2 |
| 3rd down efficiency | 6-14 | 6-10 |
| 4th down efficiency | 0-1 | 0-1 |
| Total Plays | 65 | 54 |
| Total Yards | 315 | 325 |
| Total Drives | 9 | 8 |
| Yards per Play | 4.8 | 6.0 |
| Passing | 189 | 232 |
| Comp/Att | 15/30 | 16/25 |
| Yards per pass | 6.1 | 7.7 |
| Interceptions thrown | 0 | 2 |
| Sacks-Yards Lost | 1-7 | 5-35 |
| Rushing | 126 | 93 |
| Rushing Attempts | 34 | 24 |
| Yards per rush | 3.7 | 3.9 |
| Red Zone (Made-Att) | 2-4 | 0-3 |
| Penalties | 5-40 | 8-73 |
| Turnovers | 0 | 2 |
| Fumbles lost | 0 | 0 |
| Interceptions thrown | 0 | 2 |
| Defensive / Special Teams TDs | 0 | 0 |
| Possession | 29:55 | 30:05 |
2025 Standings
National Football Conference
| NFC West | W | L | T | PCT | PF | PA |
|---|---|---|---|---|---|---|
| Seattle | 6 | 2 | 0 | .750 | 231 | 150 |
| Los Angeles | 6 | 2 | 0 | .750 | 209 | 127 |
| San Francisco | 6 | 3 | 0 | .667 | 194 | 188 |
| Arizona | 2 | 5 | 0 | .286 | 153 | 154 |
| NFC South | W | L | T | PCT | PF | PA |
|---|---|---|---|---|---|---|
| Tampa Bay | 6 | 2 | 0 | .750 | 197 | 178 |
| Carolina | 5 | 4 | 0 | .556 | 170 | 205 |
| Atlanta | 3 | 5 | 0 | .375 | 143 | 178 |
| New Orleans | 1 | 8 | 0 | .111 | 138 | 243 |
NFL News

What are the longest field goals in NFL history?
Timely field goals can change game trajectories in a dramatic fashion. Check out the longest field goals in NFL history now.
5h

What are the winningest regions in sports?
The Los Angeles Dodgers won back-to-back World Series titles in 2024 and 2025. Which areas and leagues in North America have the most sports titles?
5h
Seahawks' Sam Darnold throws 4 first-half TDs in blowout win
En route to a 38-14 win over the Commanders on Sunday night, Seahawks quarterback Sam Darnold finished 21-of-24 with 330 yards, four touchdowns and one interception, boosting his odds for NFL MVP as his team improved to 6-2.
7h