
Cincinnati Bengals @ Houston Texans
AFC WILD CARD PLAYOFF

9-7, 5-3 Away
10
9-7, 5-3 Away

10-6, 5-3 Home
31
10-6, 5-3 Home
Game Leaders


Team Stats


300
Total Yards
340
3
Turnovers
0
21
1st Downs
19
3-25
Penalties
5-87
6/13
3rd Down
6/12
0/2
4th Down
0/0
1/3
Red Zone
1/1
30:17
Possession
29:43
Game Information
Houston, TX
Team Stats
 | | |
|---|---|---|
| 1st Downs | 21 | 19 |
| Passing 1st downs | 11 | 9 |
| Rushing 1st downs | 8 | 9 |
| 1st downs from penalties | 2 | 1 |
| 3rd down efficiency | 6-13 | 6-12 |
| 4th down efficiency | 0-2 | 0-0 |
| Total Plays | 65 | 57 |
| Total Yards | 300 | 340 |
| Total Drives | 11 | 11 |
| Yards per Play | 4.6 | 6.0 |
| Passing | 224 | 152 |
| Comp/Att | 27/42 | 11/20 |
| Yards per pass | 4.9 | 6.9 |
| Interceptions thrown | 3 | 0 |
| Sacks-Yards Lost | 4-33 | 2-7 |
| Rushing | 76 | 188 |
| Rushing Attempts | 19 | 35 |
| Yards per rush | 4.0 | 5.4 |
| Red Zone (Made-Att) | 1-3 | 1-1 |
| Penalties | 3-25 | 5-87 |
| Turnovers | 3 | 0 |
| Fumbles lost | 0 | 0 |
| Interceptions thrown | 3 | 0 |
| Defensive / Special Teams TDs | 0 | 2 |
| Possession | 30:17 | 29:43 |
2025 Standings
American Football Conference
| AFC North | W | L | T | PCT | PF | PA |
|---|---|---|---|---|---|---|
| Pittsburgh | 4 | 2 | 0 | .667 | 150 | 140 |
| Cincinnati | 3 | 4 | 0 | .429 | 136 | 214 |
| Baltimore | 1 | 5 | 0 | .167 | 144 | 194 |
| Cleveland | 1 | 5 | 0 | .167 | 82 | 146 |
| AFC South | W | L | T | PCT | PF | PA |
|---|---|---|---|---|---|---|
| Indianapolis | 5 | 1 | 0 | .833 | 194 | 116 |
| Jacksonville | 4 | 3 | 0 | .571 | 146 | 155 |
| Houston | 2 | 3 | 0 | .400 | 108 | 61 |
| Tennessee | 1 | 5 | 0 | .167 | 83 | 161 |
NFL News
Week 7 NFL highlights: Best plays, moments and touchdowns
A look at the best plays around the NFL in Week 7.
22m
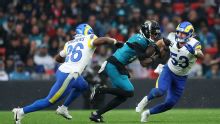
Matthew Stafford throws 5 TD passes as Rams rout Jaguars 35-7 at rainy Wembley
— Matthew Stafford threw three of his five touchdown passes to Davante Adams and the Los Angeles Rams beat the Jacksonville Jaguars 35-7 on a rainy Sunday at Wembley Stadium.
1h
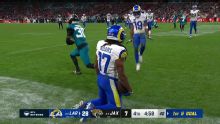
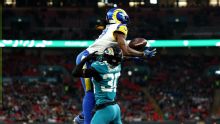
Los Angeles Rams vs. Jacksonville Jaguars Game Highlights
Los Angeles Rams vs. Jacksonville Jaguars Game Highlights
1h