
Dallas Cowboys @ Carolina Panthers
NFC Playoffs-Second Round

10-6, 4-4 Away
17
10-6, 4-4 Away

12-4, 8-0 Home
26
12-4, 8-0 Home
Game Leaders


Team Stats


244
Total Yards
227
3
Turnovers
2
21
1st Downs
18
6-61
Penalties
5-38
4/12
3rd Down
4/11
0/0
4th Down
1/2
0/0
Red Zone
0/0
30:37
Possession
29:23
Game Information
Referee:Johnny Grier
Team Stats
 | | |
|---|---|---|
| 1st Downs | 21 | 18 |
| Passing 1st downs | 12 | 7 |
| Rushing 1st downs | 5 | 8 |
| 1st downs from penalties | 4 | 3 |
| 3rd down efficiency | 4-12 | 4-11 |
| 4th down efficiency | 0-0 | 1-2 |
| Total Plays | 62 | 59 |
| Total Yards | 244 | 227 |
| Total Drives | 0 | 0 |
| Yards per Play | 3.9 | 3.8 |
| Passing | 148 | 100 |
| Comp/Att | 18/36 | 12/22 |
| Yards per pass | 3.9 | 4.5 |
| Interceptions thrown | 3 | 1 |
| Sacks-Yards Lost | 2-17 | 0-0 |
| Rushing | 96 | 127 |
| Rushing Attempts | 24 | 37 |
| Yards per rush | 4.0 | 3.4 |
| Red Zone (Made-Att) | 0-0 | 0-0 |
| Penalties | 6-61 | 5-38 |
| Turnovers | 3 | 2 |
| Fumbles lost | 0 | 1 |
| Interceptions thrown | 3 | 1 |
| Defensive / Special Teams TDs | 0 | 0 |
| Possession | 30:37 | 29:23 |
2025 Standings
National Football Conference
| NFC East | W | L | T | PCT | PF | PA |
|---|---|---|---|---|---|---|
| Philadelphia | 6 | 2 | 0 | .750 | 208 | 185 |
| Dallas | 3 | 4 | 1 | .438 | 246 | 250 |
| Washington | 3 | 5 | 0 | .375 | 187 | 198 |
| New York | 2 | 6 | 0 | .250 | 173 | 215 |
| NFC South | W | L | T | PCT | PF | PA |
|---|---|---|---|---|---|---|
| Tampa Bay | 6 | 2 | 0 | .750 | 197 | 178 |
| Carolina | 4 | 4 | 0 | .500 | 154 | 192 |
| Atlanta | 3 | 4 | 0 | .429 | 120 | 154 |
| New Orleans | 1 | 7 | 0 | .125 | 128 | 209 |
NFL News
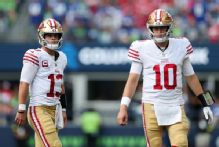
QB Purdy could be available but 49ers to start Jones vs. Giants
Quarterback Mac Jones will make his fifth straight start Sunday against the Giants while starter Brock Purdy, who could be available, continues to recover from a toe injury, coach Kyle Shanahan announced Friday.
8h

Orlovsky on Chris Grier's departure: The Dolphins are 'devoid of talent'
Dan Orlovsky defends Mike McDaniel, saying the Dolphins’ struggles stem from roster issues as GM Chris Grier and the team mutually agree to part ways.
8h
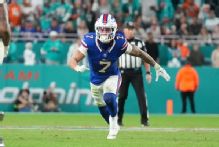
Bills CB Johnson questionable, S Rapp 'probably' done for the year
Bills nickel corner Taron Johnson is questionable for Sunday's game against the Chiefs, while coach Sean McDermott says safety Taylor Rapp is "probably" done for the season after going on injured reserve with a knee injury.
8h