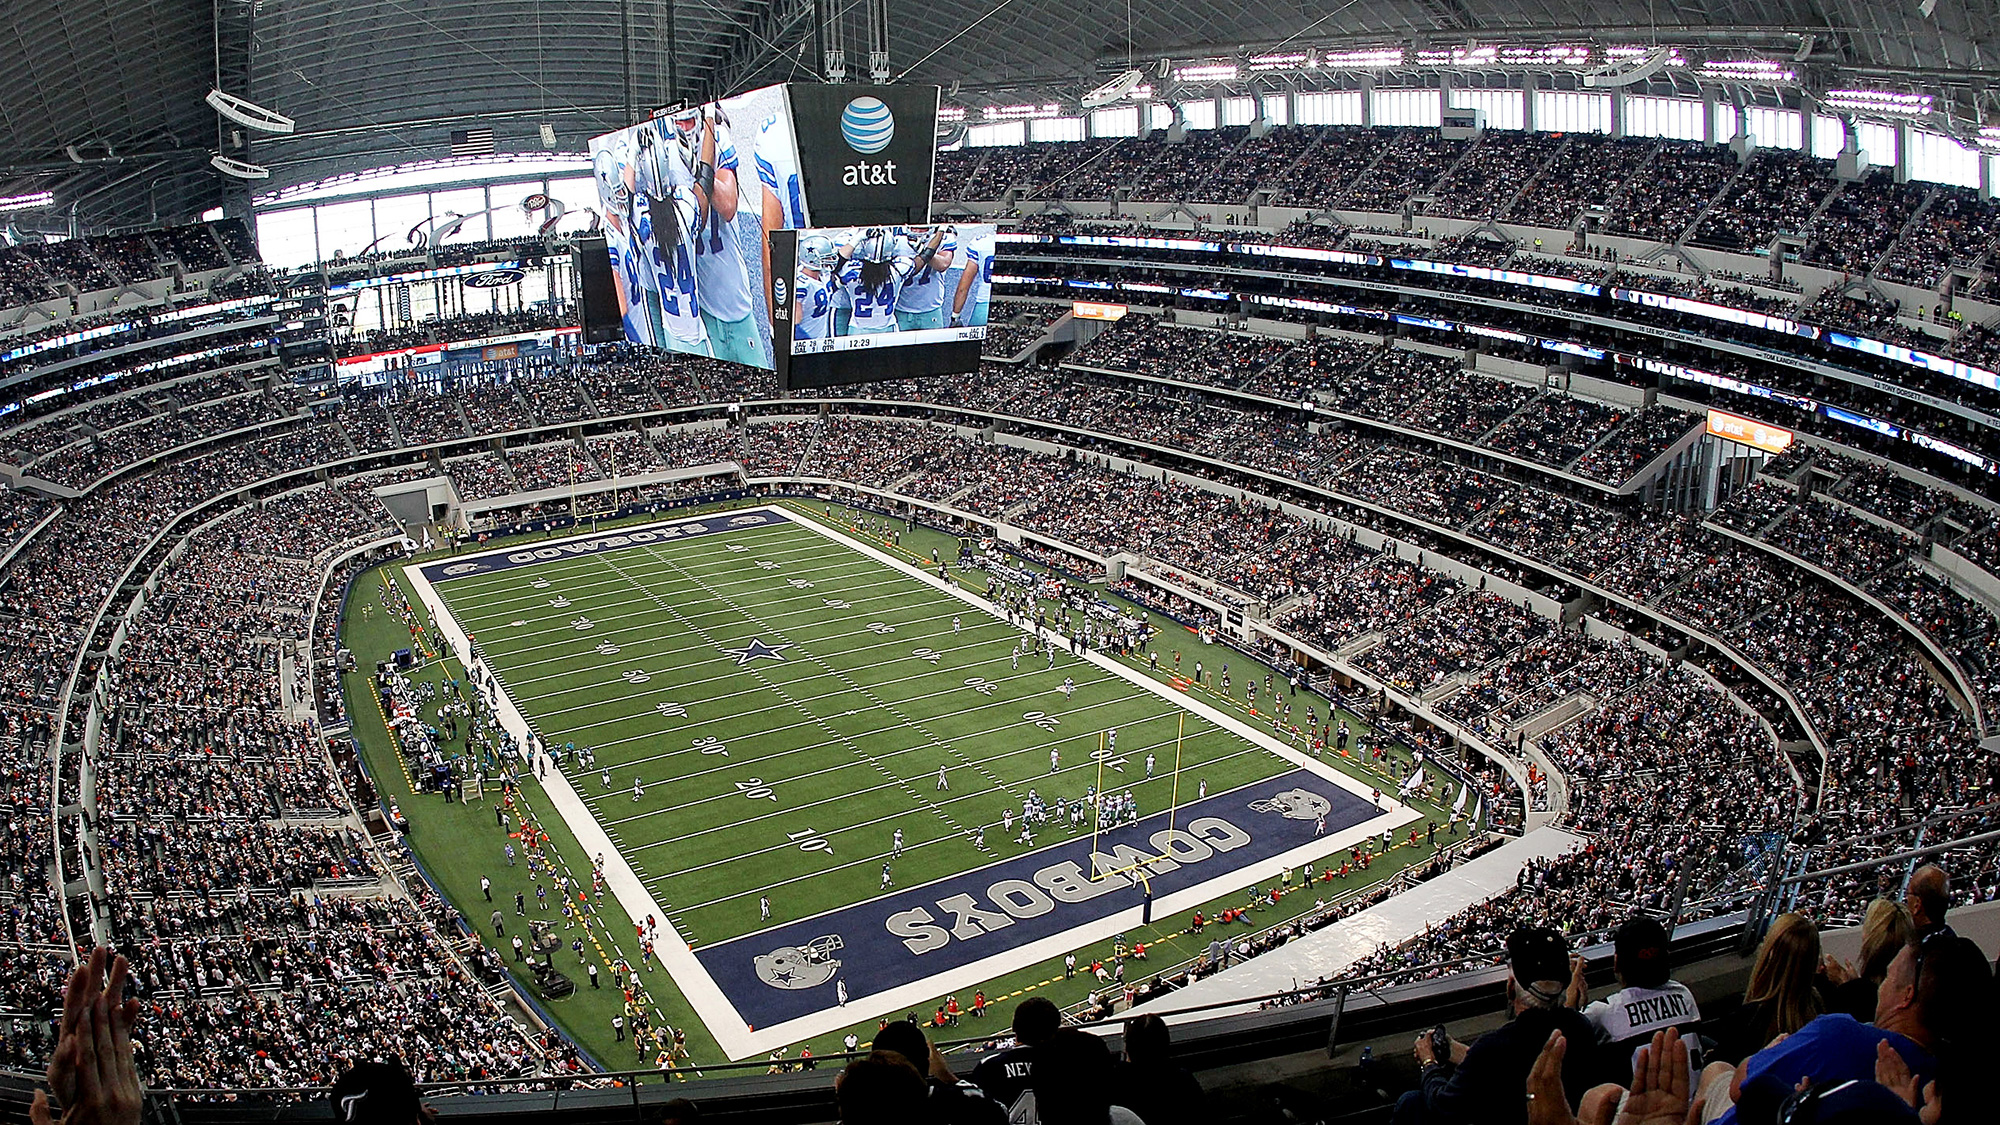
Seattle Seahawks @ Dallas Cowboys
Game Leaders
Team Stats
406
Total Yards
411
1
Turnovers
0
25
1st Downs
33
10-130
Penalties
9-127
9/14
3rd Down
8/14
0/3
4th Down
1/2
4/5
Red Zone
4/8
23:33
Possession
36:27
Game Information
Arlington, TX

Referee:Clete Blakeman
Down Judge:Dana McKenzie
Line Judge:Julian Mapp
Field Judge:John Jenkins
Back Judge:Jonah Monroe
Side Judge:Lo van Pham
Umpire:Scott Campbell

1st Quarter
Field Goal
9:10 - 1st
0
SEA
3
DAL
Brandon Aubrey 30 Yd Field Goal
14 plays, 63 yards, 5:50
Touchdown
7:28 - 1st
7
SEA
3
DAL
DK Metcalf 73 Yd pass from Geno Smith (Jason Myers Kick)
3 plays, 75 yards, 1:42
Touchdown
4:48 - 1st
7
SEA
10
DAL
CeeDee Lamb 15 Yd pass from Dak Prescott (Brandon Aubrey Kick)
5 plays, 75 yards, 2:40
2nd Quarter
Touchdown
11:37 - 2nd
7
SEA
17
DAL
Brandin Cooks 7 Yd pass from Dak Prescott (Brandon Aubrey Kick)
11 plays, 68 yards, 4:21
Touchdown
8:54 - 2nd
14
SEA
17
DAL
Zach Charbonnet 1 Yd Run (Jason Myers Kick)
7 plays, 75 yards, 2:43
Field Goal
1:30 - 2nd
14
SEA
20
DAL
Brandon Aubrey 31 Yd Field Goal
16 plays, 62 yards, 7:24
Touchdown
0:04 - 2nd
21
SEA
20
DAL
DK Metcalf 1 Yd pass from Geno Smith (Jason Myers Kick)
8 plays, 75 yards, 1:26
3rd Quarter
Touchdown
10:01 - 3rd
28
SEA
20
DAL
Geno Smith 5 Yd Run (Jason Myers Kick)
10 plays, 75 yards, 4:59
Touchdown
3:41 - 3rd
28
SEA
27
DAL
Tony Pollard 6 Yd Run (Brandon Aubrey Kick)
12 plays, 75 yards, 6:20
4th Quarter
Touchdown
14:17 - 4th
35
SEA
27
DAL
DK Metcalf 3 Yd pass from Geno Smith (Jason Myers Kick)
5 plays, 70 yards, 1:47
Field Goal
11:23 - 4th
35
SEA
30
DAL
Brandon Aubrey 38 Yd Field Goal
6 plays, 56 yards, 2:54
Touchdown
4:37 - 4th
35
SEA
38
DAL
Jake Ferguson 12 Yd pass from Dak Prescott (Dak Prescott Pass to Brandin Cooks for Two-Point Conversion)
7 plays, 54 yards, 2:27
Field Goal
1:43 - 4th
35
SEA
41
DAL
Brandon Aubrey 32 Yd Field Goal
6 plays, 35 yards, 1:28
Data is currently unavailable.
Win Probability
0%
--SEA
100%
--DAL
According to ESPN Analytics
2025 Standings
National Football Conference
| NFC West | W | L | T | PCT | PF | PA |
|---|---|---|---|---|---|---|
| Seattle | 5 | 2 | 0 | .714 | 193 | 136 |
| Los Angeles | 5 | 2 | 0 | .714 | 175 | 117 |
| San Francisco | 5 | 3 | 0 | .625 | 160 | 164 |
| Arizona | 2 | 5 | 0 | .286 | 153 | 154 |
| NFC East | W | L | T | PCT | PF | PA |
|---|---|---|---|---|---|---|
| Philadelphia | 6 | 2 | 0 | .750 | 208 | 185 |
| Dallas | 3 | 4 | 1 | .438 | 246 | 250 |
| Washington | 3 | 4 | 0 | .429 | 180 | 170 |
| New York | 2 | 6 | 0 | .250 | 173 | 215 |
NFL News

Inside the betting 'holiday' known as the sports equinox, when the NFL, MLB, NBA and NHL are all on at once
Mondays in October have had some of the best betting action all year, and now the NBA enters the mix.
2h

Bears couldn't survive their own sloppiness in loss to Ravens
The loss snapped a four-game win streak during which the Bears were able to win despite their issues.
3h

Panthers don't measure up in crushing loss to Bills
The Panthers fell to 4-4 with Sunday's loss and still don't have a victory over a team that's over .500.
3h
ESPN BET Sportsbook is owned and operated by PENN Entertainment, Inc. and its subsidiaries ('PENN'). ESPN BET is available in states where PENN is licensed to offer sports wagering. Must be 21+ to wager. If you or someone you know has a gambling problem and wants help, call 1-800-GAMBLER.
Copyright: © 2025 ESPN Enterprises, Inc. All rights reserved.


