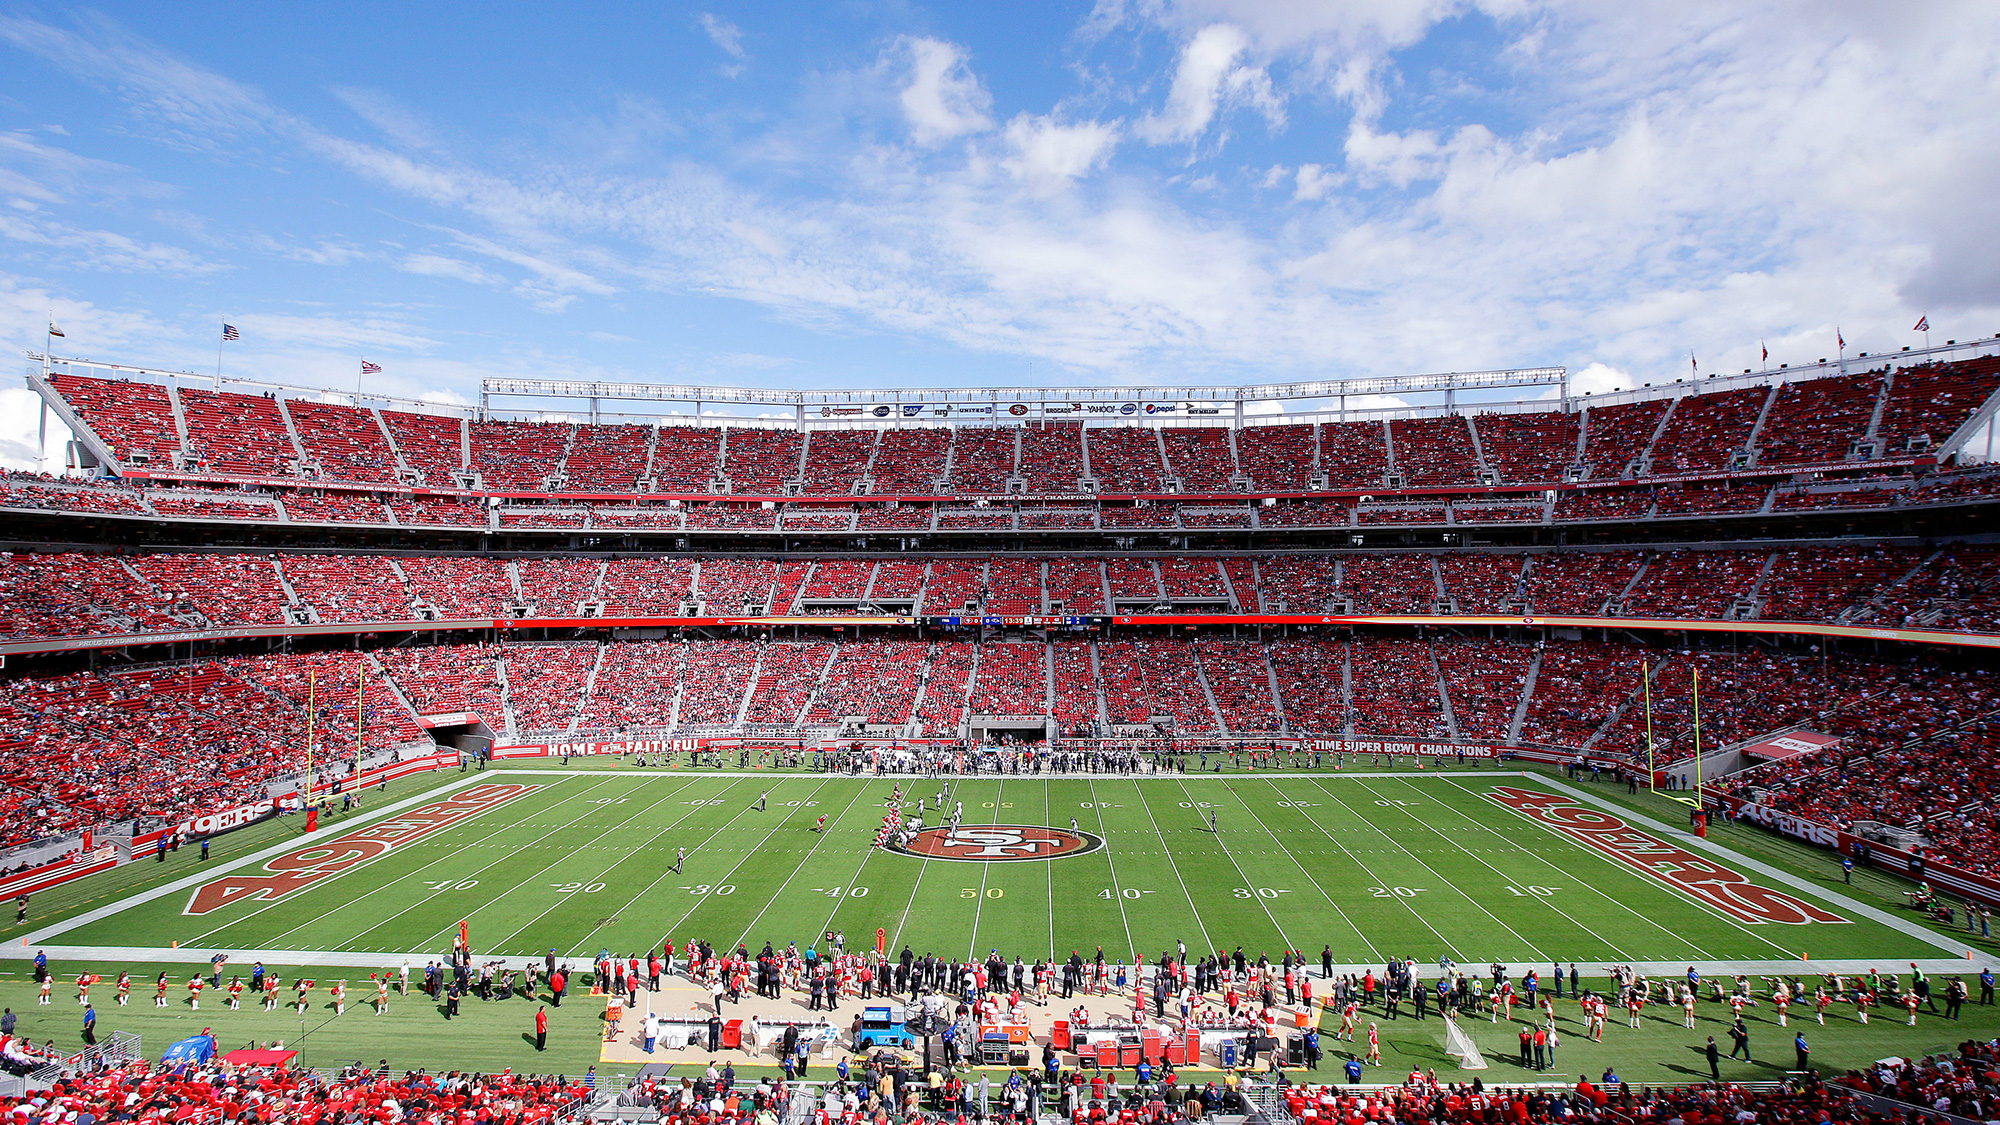
Jacksonville Jaguars @ San Francisco 49ers
Game Leaders
Team Stats
472
Total Yards
369
3
Turnovers
1
32
1st Downs
26
12-99
Penalties
8-68
5/13
3rd Down
10/15
2/2
4th Down
0/0
4/4
Red Zone
4/6
30:49
Possession
29:11
Game Information
Santa Clara, CA

Down Judge:Derick Bowers
Side Judge:James Coleman
Umpire:Ruben Fowler
Back Judge:Steve Freeman
Field Judge:Greg Gautreaux
Referee:Jeff Triplette
Back Judge:Brad Freeman
Line Judge:Danny Short

1st Quarter
Touchdown
10:18 - 1st
0
JAX
7
SF
Jimmy Garoppolo 1 Yd Run (Robbie Gould Kick)
10 plays, 79 yards, 4:42
Field Goal
5:42 - 1st
0
JAX
10
SF
Robbie Gould 27 Yd Field Goal
9 plays, 54 yards, 3:44
2nd Quarter
Touchdown
11:03 - 2nd
0
JAX
16
SF
Dontae Johnson 50 Yd Interception Return
4 plays, 29 yards, 2:21
Defensive Two Point Conversion
11:03 - 2nd
2
JAX
16
SF
Aaron Colvin Defensive PAT Conversion
4 plays, 29 yards, 2:21
Touchdown
5:10 - 2nd
9
JAX
16
SF
Leonard Fournette 1 Yd Run (Josh Lambo Kick)
11 plays, 75 yards, 5:53
Touchdown
0:10 - 2nd
16
JAX
16
SF
Jaelen Strong 5 Yd pass from Blake Bortles (Josh Lambo Kick)
8 plays, 80 yards, 1:30
3rd Quarter
Field Goal
10:57 - 3rd
19
JAX
16
SF
Josh Lambo 45 Yd Field Goal
8 plays, 48 yards, 4:03
Touchdown
6:46 - 3rd
19
JAX
23
SF
George Kittle 8 Yd pass from Jimmy Garoppolo (Robbie Gould Kick)
5 plays, 26 yards, 1:55
4th Quarter
Touchdown
10:39 - 4th
19
JAX
30
SF
Trent Taylor 5 Yd pass from Jimmy Garoppolo (Robbie Gould Kick)
13 plays, 86 yards, 6:27
Touchdown
8:59 - 4th
19
JAX
37
SF
Carlos Hyde 6 Yd Run (Robbie Gould Kick)
3 plays, 18 yards, 1:24
Touchdown
2:17 - 4th
27
JAX
37
SF
T.J. Yeldon 1 Yd Run (Blake Bortles Pass to Ben Koyack for Two-Point Conversion)
16 plays, 85 yards, 4:14
Touchdown
1:50 - 4th
33
JAX
37
SF
James O'Shaughnessy 11 Yd pass from Blake Bortles
3 plays, 46 yards, 0:27
Touchdown
1:24 - 4th
33
JAX
44
SF
Matt Breida 30 Yd Run (Robbie Gould Kick)
4 plays, 51 yards, 0:26
Data is currently unavailable.
Win Probability
0%
--JAX
100%
--SF
According to ESPN Analytics
2025 Standings
American Football Conference
| AFC South | W | L | T | PCT | PF | PA |
|---|---|---|---|---|---|---|
| Indianapolis | 7 | 1 | 0 | .875 | 270 | 154 |
| Jacksonville | 4 | 3 | 0 | .571 | 146 | 155 |
| Houston | 3 | 4 | 0 | .429 | 153 | 103 |
| Tennessee | 1 | 7 | 0 | .125 | 110 | 230 |
National Football Conference
| NFC West | W | L | T | PCT | PF | PA |
|---|---|---|---|---|---|---|
| Seattle | 5 | 2 | 0 | .714 | 193 | 136 |
| Los Angeles | 5 | 2 | 0 | .714 | 175 | 117 |
| San Francisco | 5 | 3 | 0 | .625 | 160 | 164 |
| Arizona | 2 | 5 | 0 | .286 | 153 | 154 |
NFL News

NFL Week 9 best arrivals -- from Aaron Brewer to Lamar Jackson
With Halloween coming in the midst of Week 9, some NFL players dressed for the occasion.
17m

Broncos DC Joseph confident in secondary with Surtain out
Defensive coordinator Vance Joseph said Thursday he's confident in the Broncos' plan to deal with the absence of cornerback Pat Surtain II.
31m

Newly extended Aidan Hutchinson 'all-in' on future in Detroit
With his contract finalized Wednesday -- the four-year extension is worth $180 million, with $141 million guaranteed -- Aidan Hutchinson said he's now "all-in" on a future in Detroit as the Lions eye an elusive Super Bowl ring.
41m
ESPN BET Sportsbook is owned and operated by PENN Entertainment, Inc. and its subsidiaries ('PENN'). ESPN BET is available in states where PENN is licensed to offer sports wagering. Must be 21+ to wager. If you or someone you know has a gambling problem and wants help, call 1-800-GAMBLER.
Copyright: © 2025 ESPN Enterprises, Inc. All rights reserved.


