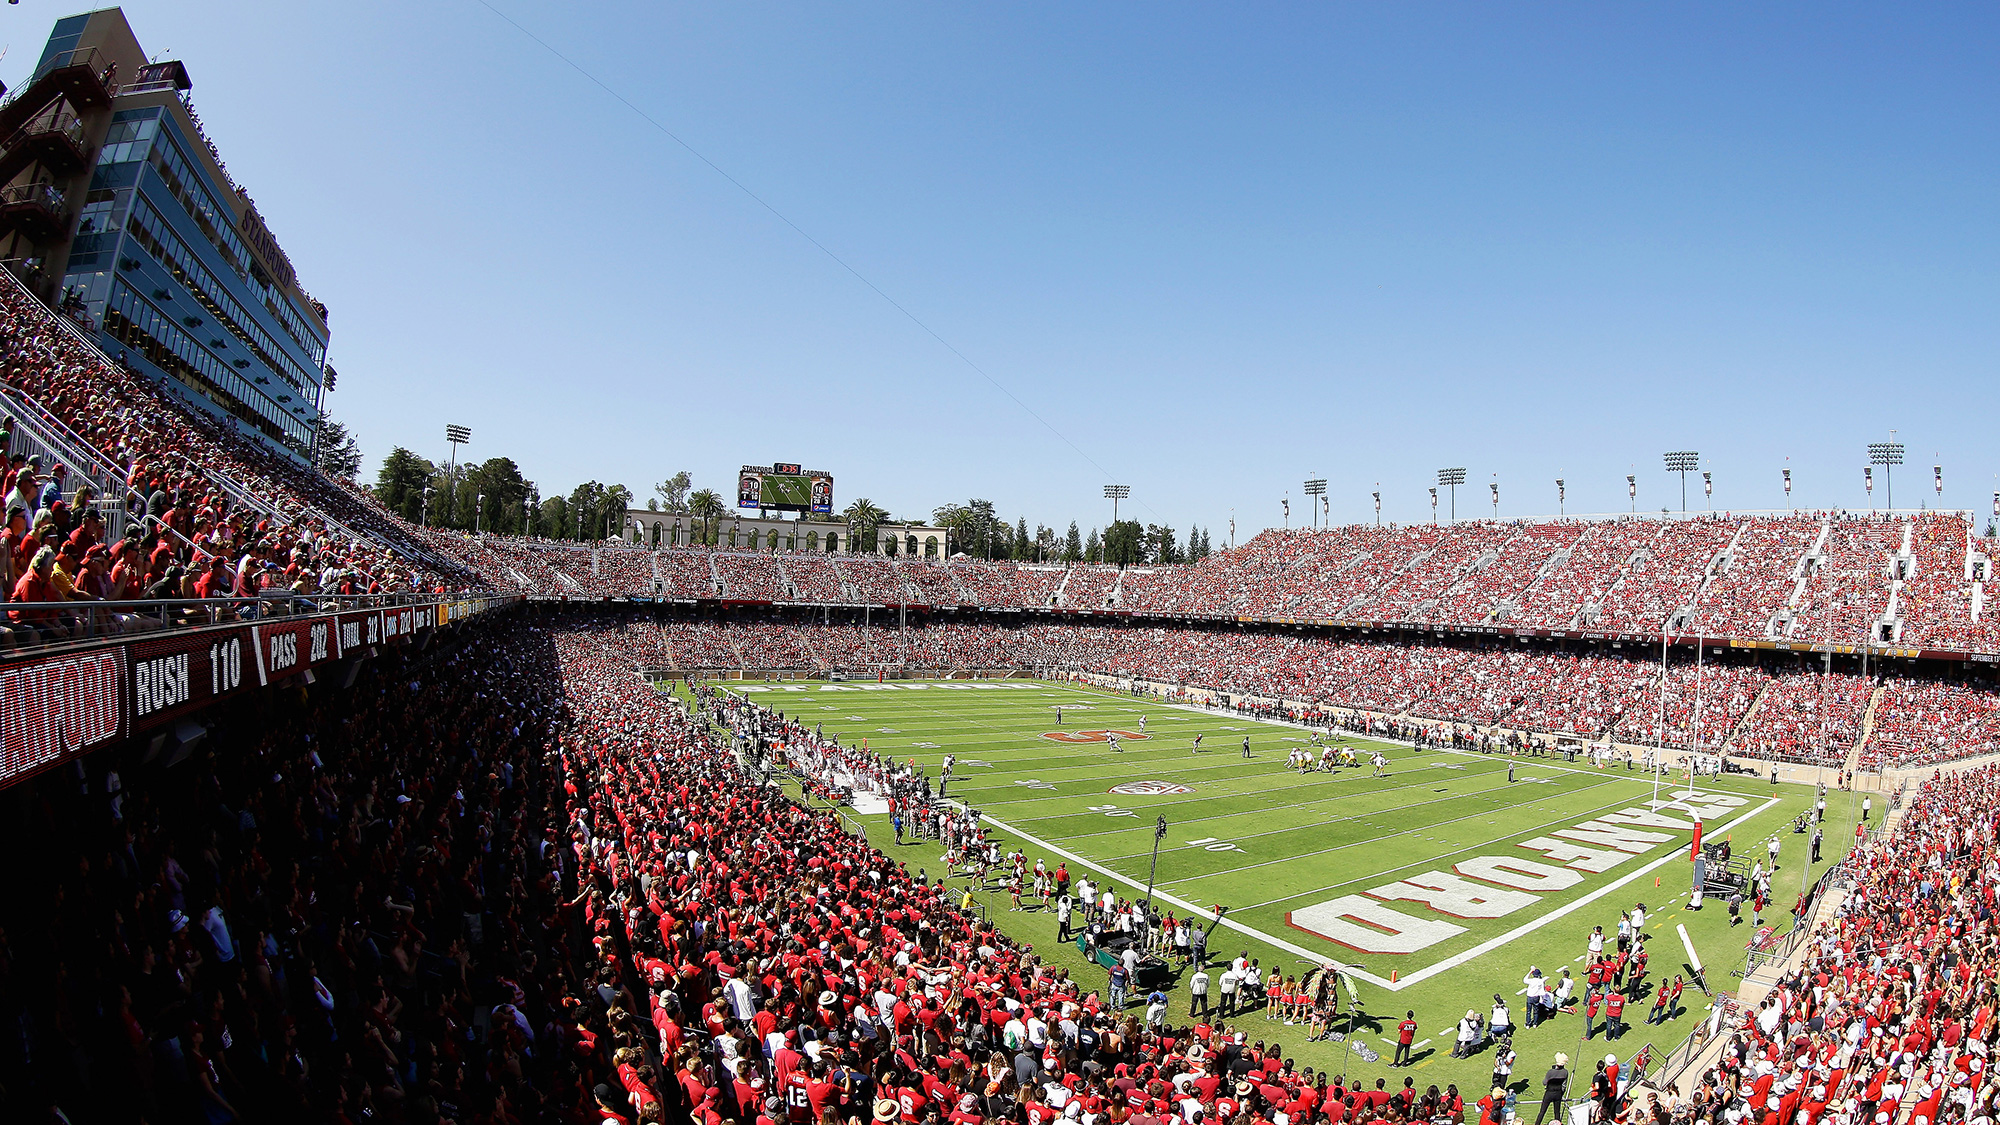
San Diego State Aztecs @ Stanford Cardinal
Game Leaders
Team Stats
263
Total Yards
382
1
Turnovers
1
11
1st Downs
19
11-125
Penalties
3-20
4/13
3rd Down
7/15
0/1
4th Down
0/0
28:50
Possession
31:10
Game Information
Stanford, CA


Team Stats
| 1st Downs | 11 | 19 |
| 3rd down efficiency | 4-13 | 7-15 |
| 4th down efficiency | 0-1 | 0-0 |
| Total Yards | 263 | 382 |
| Passing | 113 | 332 |
| Comp/Att | 10/15 | 21/31 |
| Yards per pass | 7.5 | 10.7 |
| Interceptions thrown | 0 | 1 |
| Rushing | 150 | 50 |
| Rushing Attempts | 37 | 28 |
| Yards per rush | 4.1 | 1.8 |
| Penalties | 11-125 | 3-20 |
| Turnovers | 1 | 1 |
| Fumbles lost | 1 | 0 |
| Interceptions thrown | 0 | 1 |
| Possession | 28:50 | 31:10 |
SDSU @ STAN Videos
Stanford opening up the lead with another TD pass
- 0:29
Stanford WR all alone in the end zone for an easy score
- 0:38
Stanford takes the lead after a beautiful touchdown pass and catch right before half
- 0:47
2025 Standings
FBS
| Mountain West ConferenceMountain West Conference | CONF | OVR |
|---|---|---|
| San Diego State | 4-0 | 7-1 |
| Boise State | 4-1 | 6-3 |
| Fresno State | 3-2 | 6-3 |
| Hawai'i | 3-2 | 6-3 |
| New Mexico | 3-2 | 6-3 |
| Utah State | 2-2 | 4-4 |
| UNLV | 2-2 | 6-2 |
| San José State | 2-2 | 3-5 |
| Wyoming | 2-3 | 4-5 |
| Colorado State | 1-3 | 2-6 |
| Air Force | 1-4 | 2-6 |
| Nevada | 0-4 | 1-7 |
FBS
| Atlantic Coast ConferenceAtlantic Coast Conference | CONF | OVR |
|---|---|---|
| Virginia | 5-0 | 8-1 |
| Georgia Tech | 5-1 | 8-1 |
| Pittsburgh | 5-1 | 7-2 |
| Louisville | 4-1 | 7-1 |
| SMU | 4-1 | 6-3 |
| Duke | 4-1 | 5-3 |
| Miami | 2-2 | 6-2 |
| Virginia Tech | 2-3 | 3-6 |
| NC State | 2-3 | 5-4 |
| Wake Forest | 2-3 | 5-3 |
| California | 2-3 | 5-4 |
| Clemson | 2-4 | 3-5 |
| Stanford | 2-4 | 3-6 |
| North Carolina | 1-3 | 3-5 |
| Florida State | 1-4 | 4-4 |
| Syracuse | 1-5 | 3-6 |
| Boston College | 0-5 | 1-8 |
NCAAF News

2025 Allstate Playoff Predictor
Select your favorite contender, make your picks for how its season will play out and see what the Allstate Playoff Predictor foretells.
2h

Catch ABC's amazing college football tripleheader this weekend
BYU takes on Texas Tech, Missouri hosts Texas A&M and LSU faces Alabama, all on ABC this Saturday.
4h

Get ready for 'College Football Primetime' as Tulane takes on Memphis
Tulane travels to Memphis for "College Football Primetime"; tune in at 9 p.m. ET on ESPN.
4h
ESPN BET Sportsbook is owned and operated by PENN Entertainment, Inc. and its subsidiaries ('PENN'). ESPN BET is available in states where PENN is licensed to offer sports wagering. Must be 21+ to wager. If you or someone you know has a gambling problem and wants help, call 1-800-GAMBLER.
Copyright: © 2025 ESPN Enterprises, Inc. All rights reserved.


