
USC Trojans @ Oklahoma Sooners
ORANGE BOWL

13-0, 7-0 Away
55
13-0, 7-0 Away

12-1, 8-1 Home
19
12-1, 8-1 Home
Game Leaders

Team Stats


525
Total Yards
372
0
Turnovers
5
19
1st Downs
19
0-0
Penalties
0-0
4/14
3rd Down
8/17
2/2
4th Down
0/1
15:33
Possession
21:06
Game Information
Los Angeles, CA

Team Stats
 | | |
|---|---|---|
| 1st Downs | 19 | 19 |
| 3rd down efficiency | 4-14 | 8-17 |
| 4th down efficiency | 2-2 | 0-1 |
| Total Yards | 525 | 372 |
| Passing | 341 | 264 |
| Comp/Att | 18/35 | 24/36 |
| Yards per pass | 9.5 | 6.8 |
| Interceptions thrown | 0 | 3 |
| Rushing | 193 | 128 |
| Rushing Attempts | 28 | 40 |
| Yards per rush | 6.9 | 3.2 |
| Penalties | 0-0 | 0-0 |
| Turnovers | 0 | 5 |
| Fumbles lost | 0 | 2 |
| Interceptions thrown | 0 | 3 |
| Possession | 15:33 | 21:06 |
2025 Standings
FBS
| Big Ten Conference | CONF | OVR |
|---|---|---|
| Indiana | 7-0 | 10-0 |
| Ohio State | 6-0 | 9-0 |
| USC | 5-1 | 7-2 |
| Oregon | 5-1 | 8-1 |
| Michigan | 5-1 | 7-2 |
| Iowa | 4-2 | 6-3 |
| Minnesota | 4-2 | 6-3 |
| Nebraska | 4-3 | 7-3 |
| Washington | 3-3 | 6-3 |
| Northwestern | 3-3 | 5-4 |
| Illinois | 3-3 | 6-3 |
| UCLA | 3-3 | 3-6 |
| Rutgers | 2-5 | 5-5 |
| Maryland | 1-5 | 4-5 |
| Wisconsin | 1-5 | 3-6 |
| Michigan State | 0-6 | 3-6 |
| Penn State | 0-6 | 3-6 |
| Purdue | 0-7 | 2-8 |
NCAAF News
Who are SEC Now's top-five rushing offenses in the SEC?
Matt Stinchcomb and Gene Chizik rank the best rushing teams in the SEC and explain how they are able to produce on the ground every week.
7h
The Latest: 19 teams in the AP Top 25 take new spots
A month before the playoff matchups are set and things are unsettled: The latest AP Top 25 college football poll has 19 teams in new spots, including Texas at No. 10.
7h
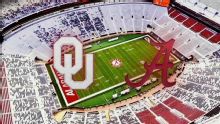
What No. 11 Oklahoma must do to walk out victorious vs. No. 4 Alabama
SEC Now's Matt Stinchcomb harps on taking care of the ball, succeeding on third-downs and not settling for field goals if the Sooners want to come out with a win against the Tide.
7h