
BOSTON -- Where does the future of basketball analytics lie? After spending some time at the MIT Sloan Sports Analytics Conference in Boston, it has become increasingly clear that "where" is the operative word.
TrueHoop at MIT Sloan Sports Analytics Conference
More and more, researchers are trying to identify, quantify and analyze the location of where NBA players operate on the court. The two research paper finalists at Sloan, "Deconstructing the Rebound with Optical Tracking Data" and "Court Vision: New Visual and Spatial Analytics for the NBA," addressed this new, exciting area of basketball analytics.
Deconstructing the Rebound with Optical Tracking Data “leverages STATS’ SportVu Optical Tracking data to deconstruct previously hidden aspects of rebounding.” Using SportVu’s technology, researchers Rajiv Maheswaran, Yu-Han Chang, Aaron Henehan and Samantha Danesis attempted to find the relationships between rebound location, shot location and offensive rebounding rates.
The chart and graphics below reveal some interesting data related to the probability of whether a rebound will be offensive or defensive depending upon how far from the basket that rebound is collected.
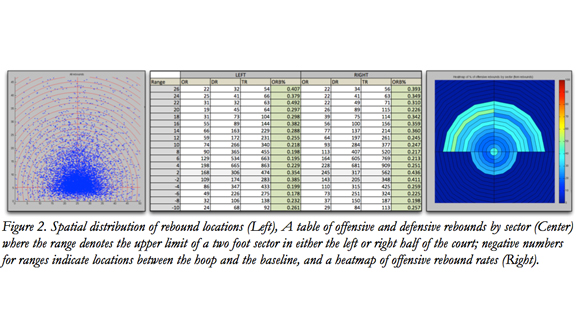
According to their research, rebounds collected within two feet of the basket have a 40 percent chance of being an offensive rebound. The percentage chance that the rebound will be offensive drops down to 22 percent between 2 and 10 feet from the basket. Once the ball moves farther outside that range, however, the chance that the rebound will be offensive starts to rise back up, passing the 40 percent plateau again when the ball gets 22 to 26 feet from the basket upon being officially rebounded. As detailed by the researchers, this generally aligns with the expectation that most offensive rebounds are grabbed very close to the hoop (such as tip-ins) or are long rebounds.
Interestingly, there was also a split in the data depending on which side of the court the ball landed on. As you can see in the graphic on the above, the location where a rebound has the highest percentage of being an offensive rebound is between 22 and 24 feet on the offense’s right side of the court. Rebounds in this range on this side of the court have a 49.2 percent chance of being an offensive rebound. In the same distance range on the opposite side of the court, rebounds only have a 31.0 percent chance of being grabbed by the offense.
However, this doesn't mean that players should just stand between 22 and 24 feet away from the hoop on the offense’s right side and just hope a rebound falls into their hands. The research discovered that there was another, possibly more important factor in determining how and where a rebound would land: the location of the actual field goal attempt. The chart below is similar to the one above; only this time it charts percentage of offensive rebounds by location of the shot attempt.
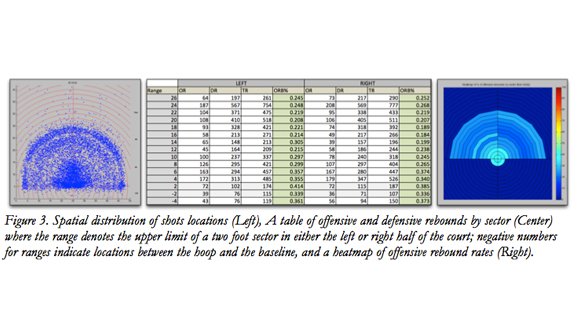
Predictably, shots extremely close to the basket, those from two feet and closer, stood the highest percentage chance of being turned into an offensive rebound. That percentage mostly declined the farther away from the basket the shot attempt came from, but it took a jump back up once the shot location passed the 3-point line. According to the research paper:
“We note that there is a “U”-like affect [sic] when looking at offensive rebound rates as a function of shot distance. This is very similar to the effective field goal percentage as a function of shot distance. This result implies that mid-range shots are even worse than previously characterized due to their effects on offensive rebound rates. Strategically, teams have even more reason to eschew mid-range shots for shots closer to the basket or three-pointers.”
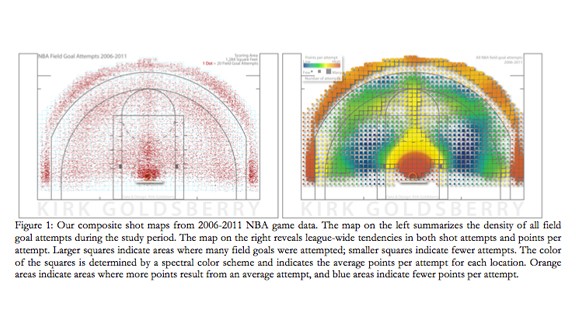
This research paper’s contention that shot location was an extremely important factor in the probability of grabbing an offensive rebound dovetails nicely with the crux of the Court Vision: New Visual and Spatial Analytics for the NBA research paper. Researcher Kirk Goldsberry is at the forefront of a movement to identify which NBA players are the most effective shooters from specific places on the floor, as well as those who are the most effective shooters from the highest quantity of locations on the floor. While some Web sites and metrics track shot location by simple distance from the basket, Goldsberry’s study tracks the exact location of the attempt by using the spatially identified {x, y} coordinates from which the attempt came.
Goldsberry contends that field goal percentage (FG%) is not the best measure of who the best shooters in the NBA are. This is not really all that surprising a contention. Tyson Chandler leads the NBA in FG%, but you probably couldn’t find anyone who thinks he’s the best shooter in the NBA. Big men, and centers in particular, take a much higher percentage of their shots from closer to the basket, so their FG% is likely to be higher than a guard or wing player who shoots from all over the court. Close shots are easy to make. By mapping over 700,000 field goal attempts for every NBA game played between 2006 and 2011, Goldsberry was able to quantify shooting range in a different way.
By dividing the most common shot locations into 1,284 “cells,” Goldsberry created a metric called "Spread%." Spread% is a measure of how many of those 1,284 cells a player has attempted at least one shot from. This, of course, helps explain why no one would consider Chandler the best shooter in the league. His Spread% is much lower than someone like Ray Allen, who takes shots from many more locations on the floor. Allen’s shots typically come from locations where the shots are considerably harder to make, and, if he’s behind the 3-point line, worth an extra point. To illustrate this disparity, Goldsberry did a graphical comparison of the Spread% for Allen and Al Jefferson.

Using that Spread% data, Goldsberry went even deeper and created another metric called "Range%." Range% is the percentage of locations on those 1,284 cells where a player averages more than one point per attempt (PPA). The leaders in this metric were an unsurprising mix of guards, wings and a forward. Steve Nash led the way with a 31.6 Range%, followed closely by Ray Allen at 30.1%, Kobe Bryant at 29.8% and Dirk Nowitzki at 29.0%.
By quantifying how many locations on the court a player is an effective shooter from and just how effective he is from those locations, these measures of shooting prowess can give us a better idea of who the best shooters in the NBA really are.
While these metrics are new, exciting and on the cutting edge of basketball analytics, they are barely scratching the surface of what we may eventually be able to quantify and evaluate through spatial analysis. How much ground does Dwight Howard cover when he defends a pick-and-roll? By how much does LeBron James’ FG% drop (or rise) when he shoots a fade-away rather than going straight up? Which NBA teams have the best and most efficient floor spacing on offense? These are all things that researchers, analysts, writers, general managers, coaches and fans are going to be able to track sometime in the near future.
Jared Dubin is a writer for Hardwood Paroxysm, part of the TrueHoop Network. Follow him on Twitter (@JADubin5).