


Game Information
Optus Stadium
| fourth Quarter | |||
|---|---|---|---|
| Time | Team | Play | Score |
| 31:21 |  | Rushed | 49 - 136 |
| 29:12 |  | T. Kelly Behind | 49 - 135 |
| 26:31 | | O. Allen Goal | 48 - 135 |
| 22:44 | | D. Rioli Goal | 42 - 135 |
| 18:51 | | B. King Goal | 42 - 129 |
| 16:59 | | B. Long Goal | 42 - 123 |
| 15:32 | | Rushed | 42 - 117 |
| 14:20 | | Rushed | 42 - 116 |
| 13:10 | | B. King Behind | 42 - 115 |
| 11:31 | | J. Rogers Goal | 42 - 114 |
| 10:10 | | J. Rogers Goal | 42 - 108 |
| 8:20 | | B. King Goal | 42 - 102 |
| 5:22 | | L. Baker Behind | 42 - 96 |
| 2:20 | | M. Owies Goal | 41 - 96 |
| 1:11 | | Rushed | 35 - 96 |
| third Quarter | |||
| Time | Team | Play | Score |
| 28:59 | | E. Read Behind | 35 - 95 |
| 27:59 | | S. Clohesy Behind | 35 - 94 |
| 26:20 | | B. Long Goal | 35 - 93 |
| 25:04 | | M. Flynn Goal | 35 - 87 |
| 22:53 | | B. King Goal | 29 - 87 |
| 19:28 | | T. Miller Goal | 29 - 81 |
| 18:16 | | H. Reid Goal | 29 - 75 |
| 14:28 | | B. King Goal | 23 - 75 |
| 13:08 | | A. Sexton Behind | 23 - 69 |
| 10:27 | | J. Waterman Goal | 23 - 68 |
| 6:22 | | W. Graham Goal | 17 - 68 |
| 5:18 | | T. Miller Behind | 17 - 62 |
| 2:04 | | T. Brockman Behind | 17 - 61 |
| second Quarter | |||
| Time | Team | Play | Score |
| 29:52 | | Rushed | 16 - 61 |
| 26:46 | | N. Long Behind | 16 - 60 |
| 22:35 | | B. Long Goal | 15 - 60 |
| 19:37 | | N. Holman Behind | 15 - 54 |
| 17:05 | | B. Long Goal | 15 - 53 |
| 15:50 | | Rushed | 15 - 47 |
| 14:03 | | B. King Goal | 14 - 47 |
| 11:02 | | E. Hewett Behind | 14 - 41 |
| 8:19 | | E. Read Goal | 13 - 41 |
| 1:11 | | D. Rioli Goal | 13 - 35 |
| first Quarter | |||
| Time | Team | Play | Score |
| 29:05 | | E. Read Behind | 13 - 29 |
| 27:04 | | T. Miller Goal | 13 - 28 |
| 22:57 | | Rushed | 13 - 22 |
| 18:19 | | B. King Goal | 13 - 21 |
| 16:58 | | W. Graham Behind | 13 - 15 |
| 15:48 | | H. Reid Behind | 13 - 14 |
| 14:34 | | J. Rogers Goal | 12 - 14 |
| 11:27 | | B. King Behind | 12 - 8 |
| 8:48 | | O. Allen Goal | 12 - 7 |
| 7:28 | | B. Long Behind | 6 - 7 |
| 2:47 | | J. Waterman Goal | 6 - 6 |
| 1:05 | | E. Read Goal | 0 - 6 |
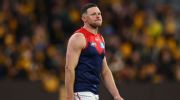
Veteran Melbourne defender Steven May was a notable absentee from training, six weeks out from the start of the AFL season.
Simon Goodwin wants to be a sounding board for Sydney coach Dean Cox as the Swans look to return to the top of the AFL ladder.
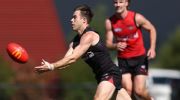
The former Bombers captain had a flawless pre-season, until illness forced him to miss the AFL club's team photo day at The Hangar on Tuesday.
Sam Draper's Brisbane Lions debut will be delayed by a foot stress fracture that will sideline him for the start of the AFL season.
Brisbane coach Chris Fagan insists Lachie Neale is enjoying his best pre-season in years despite the Lions champion dealing with significant personal issues.
Will Day's AFL season has already been put on hold after the luckless Hawthorn star suffered an injury during preseason training.
| POS | Team | Pts. | % | Form |
|---|---|---|---|---|
| 1 |
 ADEL ADEL
|
72 | 139.3 | WWWWW |
| 2 |
 GEEL GEEL
|
68 | 141.5 | WWWWW |
| 3 |
 BL BL
|
66 | 114.2 | LWLWW |
| 4 |
 COLL COLL
|
64 | 122.4 | WLLLW |
| 5 |
 GWS GWS
|
64 | 115.3 | WLWWW |
| 6 |
 FRE FRE
|
64 | 109.0 | WWWLW |
| 7 |
 SUNS SUNS
|
60 | 124.9 | WWLLW |
| 8 |
 HAW HAW
|
60 | 120.9 | WLWWL |
| 9 |
 WB WB
|
56 | 137.0 | WWWWL |
| 10 |
 SYD SYD
|
48 | 97.0 | LWWLW |
| 11 |
 CARL CARL
|
36 | 96.7 | LLLWW |
| 12 |
 STK STK
|
36 | 88.5 | WWWWL |
| 13 |
 PORT PORT
|
36 | 79.8 | LLLLW |
| 14 |
 MELB MELB
|
28 | 93.3 | LWLLL |
| 15 |
 ESS ESS
|
24 | 69.5 | LLLLL |
| 16 |
 NMFC NMFC
|
22 | 76.3 | LLLWL |
| 17 |
 RICH RICH
|
20 | 66.0 | LLLLL |
| 18 |
 WCE WCE
|
4 | 60.1 | LLLLL |