


Game Information
Blundstone Arena
| fourth Quarter | |||
|---|---|---|---|
| Time | Team | Play | Score |
| 30:11 |  | H. Rowston Goal | 75 - 103 |
| 28:05 |  | T. Thomas Goal | 75 - 97 |
| 26:38 | | Rushed | 69 - 97 |
| 23:09 | | L. Whitfield Behind | 68 - 97 |
| 18:17 | | N. Larkey Goal | 68 - 96 |
| 17:07 | | T. Bedford Behind | 62 - 96 |
| 14:00 | | J. Hogan Goal | 62 - 95 |
| 12:10 | | N. Larkey Behind | 62 - 89 |
| 7:16 | | T. Powell Goal | 61 - 89 |
| 6:42 | | Rushed | 55 - 89 |
| 4:17 | | Rushed | 55 - 88 |
| 1:55 | | T. Bedford Goal | 55 - 87 |
| third Quarter | |||
| Time | Team | Play | Score |
| 30:42 | | T. Greene Goal | 55 - 81 |
| 28:05 | | T. Greene Goal | 55 - 75 |
| 26:55 | | Rushed | 55 - 69 |
| 21:39 | | J. Riccardi Goal | 55 - 68 |
| 19:14 | | D. Lloyd Behind | 55 - 62 |
| 13:31 | | Rushed | 55 - 61 |
| 11:02 | | N. Larkey Goal | 55 - 60 |
| 9:10 | | X. O'Halloran Goal | 49 - 60 |
| 5:34 | | S. Coniglio Behind | 49 - 54 |
| 4:47 | | C. Coleman-Jones Behind | 49 - 53 |
| 3:16 | | C. Ward Goal | 48 - 53 |
| 1:08 | | N. Larkey Goal | 48 - 47 |
| second Quarter | |||
| Time | Team | Play | Score |
| 27:45 | | N. Larkey Behind | 42 - 47 |
| 21:46 | | T. Greene Behind | 41 - 47 |
| 18:23 | | J. Hogan Goal | 41 - 46 |
| 16:08 | | T. Thomas Goal | 41 - 40 |
| 14:05 | | N. Larkey Goal | 35 - 40 |
| 10:31 | | L. Shiels Behind | 29 - 40 |
| 9:43 | | T. Greene Behind | 28 - 40 |
| 8:30 | | T. Greene Goal | 28 - 39 |
| 7:18 | | T. Thomas Goal | 28 - 33 |
| 5:17 | | E. Ford Goal | 22 - 33 |
| 2:34 | | C. Brown Goal | 16 - 33 |
| first Quarter | |||
| Time | Team | Play | Score |
| 27:37 | | C. Brown Goal | 16 - 27 |
| 26:01 | | C. Brown Goal | 16 - 21 |
| 24:31 | | C. Zurhaar Behind | 16 - 15 |
| 23:57 | | J. Fahey Behind | 15 - 15 |
| 22:14 | | T. Bedford Goal | 15 - 14 |
| 20:30 | | Rushed | 15 - 8 |
| 15:22 | | J. Riccardi Goal | 14 - 8 |
| 9:53 | | G. Wardlaw Goal | 14 - 2 |
| 8:26 | | J. Riccardi Behind | 8 - 2 |
| 6:27 | | C. Coleman-Jones Behind | 8 - 1 |
| 4:11 | | X. O'Halloran Behind | 7 - 1 |
| 3:00 | | P. Spicer Goal | 7 - 0 |
| 0:56 | | Rushed | 1 - 0 |
The ESPN Footy Podcast crew discuss their unanimous pick of Jagga Smith for this season's Rising Star and whether Smith's immense preseason hype is justified.
Jake Michaels reveals his No. 1 player going into the new season, with Bulldogs skipper Marcus Bontempelli ranked at the top.
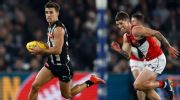
Opening Round of the AFL season gets underway Thursday evening with a blockbuster clash between Sydney and Carlton at the SCG. Here's the latest selection news and team whispers.
The 2026 AFL season has arrived, so it's time to project the win total over/under for each of the 18 teams. Who will hit the over? Who will fall under?
We graded positions for every AFL team and stacked them 1 to 18. Who has the best overall list? Who looks shaky? And which team should you watch out for in 2026?
Who should you be tipping in Opening Round of the 2026 AFL season? Our footy experts have put their heads together to help you out. So open your ESPN Footytips app, take notes, and get ahead of the game!
| POS | Team | Pts. | % | Form |
|---|---|---|---|---|
| 1 |
 ADEL ADEL
|
72 | 139.3 | WWWWW |
| 2 |
 GEEL GEEL
|
68 | 141.5 | WWWWW |
| 3 |
 BL BL
|
66 | 114.2 | LWLWW |
| 4 |
 COLL COLL
|
64 | 122.4 | WLLLW |
| 5 |
 GWS GWS
|
64 | 115.3 | WLWWW |
| 6 |
 FRE FRE
|
64 | 109.0 | WWWLW |
| 7 |
 SUNS SUNS
|
60 | 124.9 | WWLLW |
| 8 |
 HAW HAW
|
60 | 120.9 | WLWWL |
| 9 |
 WB WB
|
56 | 137.0 | WWWWL |
| 10 |
 SYD SYD
|
48 | 97.0 | LWWLW |
| 11 |
 CARL CARL
|
36 | 96.7 | LLLWW |
| 12 |
 STK STK
|
36 | 88.5 | WWWWL |
| 13 |
 PORT PORT
|
36 | 79.8 | LLLLW |
| 14 |
 MELB MELB
|
28 | 93.3 | LWLLL |
| 15 |
 ESS ESS
|
24 | 69.5 | LLLLL |
| 16 |
 NMFC NMFC
|
22 | 76.3 | LLLWL |
| 17 |
 RICH RICH
|
20 | 66.0 | LLLLL |
| 18 |
 WCE WCE
|
4 | 60.1 | LLLLL |